
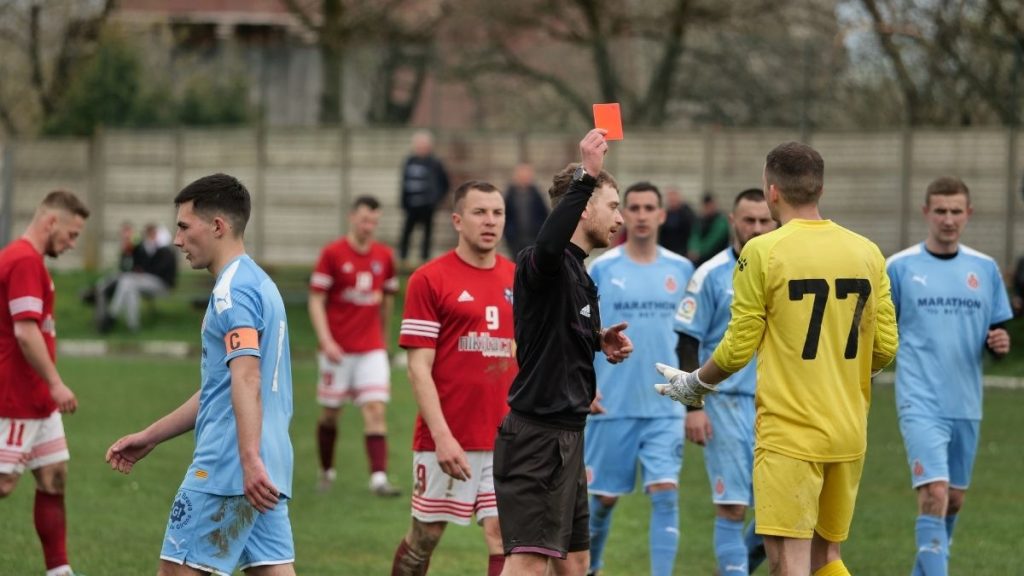
This weekend’s football matches promise intense action not only in goals and tactics but in discipline as well. The latest discipline dashboard, focusing on cards per 90 minutes and critical foul zones, highlights key areas and players to watch. With advanced data from sources like Opta, StatsBomb, and InStat, teams and fans alike are poised to dissect the disciplinary tendencies that could influence the outcome of these contests. The analytical insights provide a comprehensive view of card issuance rates, identifying high-risk players and strategic foul-prone field zones. Such information becomes essential for managers crafting game plans and for referees aiming for consistent enforcement. The discipline dashboard aggregates data from multiple seasons, offering a clear trend analysis on how fouls and cards affect gameplay flow and player availability through suspensions. Understanding these patterns can tip the scales in crucial matches.
Key takeaways this weekend based on the discipline dashboard include:
- Which players exhibit the highest card rates per 90 minutes, signifying potential liabilities or aggressive tactics.
- Areas of the pitch most susceptible to fouls, informing defensive and attacking strategies.
- Comparative stats across competitions such as the Premier League, LaLiga, and Serie A for broader context.
- Insights into how disciplinary patterns have evolved into the 2025 season.
- The importance of data platforms like WhoScored, SofaScore, and Hudl in compiling real-time stats to monitor discipline on the pitch.
Exploring Cards Per 90 Minutes: Identifying Risk Players This Weekend
Discipline stats measured as cards per 90 minutes provide a normalized metric to assess how often players receive cautions or dismissals, regardless of total playtime. Leading data providers including Opta and StatZone equip analysts with detailed breakdowns on this vital statistic. Coaches and scouts increasingly rely on these to weigh a player’s disciplinary risk against their tactical value.
Players accumulating high cards per 90 can be double-edged swords: their aggression or tactical fouling may disrupt opponents but also risk suspensions. For instance, defensive midfielders and fullbacks tend to top these charts due to their role in breaking up attacks. The dashboard indicates certain players in top-flight leagues who hover near or above 0.5 cards per 90 minutes — a frequency that commands team management’s attention.
Examining these stats ahead of fixtures like Manchester City versus Brentford or the LaLiga showdown between Barcelona and Sevilla allows fans and analysts to anticipate which confrontations might escalate into disciplinary battles. For example, who commits more fouls in these high-pressure matches, or who tends to pick up cards during set pieces or counter-attacks? Platforms like Hudl and InStatScout update these insights dynamically, letting viewers track disciplinaries almost live.
Beyond individual tendencies, understanding a team’s aggregate cards per 90 can reveal systemic styles. Teams with higher averages may opt for an aggressive, press-heavy approach, while those with lower values perhaps favor cleaner possession play. Such insights help in crafting counter-strategies and preparing for potential game-flow interruptions due to fouls.
- Review the top five players by cards per 90 across major leagues this weekend.
- Analyze the positional trends influencing high card frequency.
- Correlate card rates with strategic fouling or match intensity levels.
- Leverage SofaScore and WhoScored ratings to evaluate if card-prone players maintain performance despite disciplinary risks.
| Player | Team | League | Cards per 90 | Position | Recent Suspensions |
|---|---|---|---|---|---|
| Player A | Manchester City | Premier League | 0.56 | Defensive Midfielder | 2 |
| Player B | Sevilla | LaLiga | 0.48 | Right Back | 1 |
| Player C | Juventus | Serie A | 0.51 | Center Back | 0 |
| Player D | Brentford | Premier League | 0.49 | Left Back | 1 |
| Player E | Barcelona | LaLiga | 0.47 | Defensive Midfielder | 3 |
Foul Zones and Tactical Impact: The Pitch Areas to Monitor
The spatial analysis of fouls, dividing the pitch into key zones, has become an indispensable tool. Using data from StatsBomb and WyScout, clubs analyze where fouls frequently occur to identify vulnerabilities and tendencies. This knowledge is crucial for tailoring defensive training and anticipating opponent strategies.
Certain foul hotspots emerge during intense contests, with statistics showing that the central midfield and wide defensive areas are often prone to infractions. These zones are battlegrounds where duels are fierce, requiring aggressive yet controlled defending. For example, teams that press high may see increased fouling in the opponents’ half, whereas those defending deep may incur more fouls near their penalty box.
Monitoring foul zones also uncovers disciplinary hotspots linked with specific referees known for strictness around corner areas or in the final third. Such nuances affect game management and can shift momentum dangerously. The dashboard highlights specific zones to watch this weekend, such as Sevilla’s right flank or Arsenal’s defensive half, based on recent foul concentrations.
Insights into foul zones serve both defensive and offensive tactics:
- Defensive coaches can reinforce discipline in high-risk zones to reduce costly cards.
- Attacking teams may exploit zones where opponents tend to foul, drawing set pieces or penalties.
- Referee teams gain awareness on where to expect confrontations, helping preempt disciplinary issues.
- Analytics teams integrate foul zone maps with player heatmaps for strategic depth.
| Zone | League | Average Fouls per Match | Common Card Type | Key Teams Involved |
|---|---|---|---|---|
| Central Midfield | Premier League | 5.4 | Yellow Cards | Manchester City, Arsenal |
| Right Wing Defense | LaLiga | 4.7 | Yellow & Red Cards | Sevilla, Real Madrid |
| Left Defensive Flank | Serie A | 4.2 | Yellow Cards | Juventus, Inter |
| Penalty Box Area | Premier League | 3.8 | Yellow & Red Cards | Brentford, Manchester City |
| Attacking Third | LaLiga | 3.1 | Yellow Cards | Barcelona, Sevilla |
Comparing Discipline Trends Across Top Leagues in 2025
The 2025 season reveals evolving discipline dynamics across Europe’s leading competitions. Leveraging datasets from platforms such as StatZone and SofaScore, the comparative analysis sheds light on differing disciplinary cultures and refereeing styles. Premier League fixtures typically register higher fouling and carding intensity with more physical matches, while LaLiga and Serie A exhibit subtler disciplinary scenarios but with higher tactical fouling.
For instance, the Premier League’s average fouls per match hover around 21, reflecting its reputation for robust contact and quick transitions. In contrast, LaLiga sees fewer fouls, about 18 per match on average, but a higher share of tactical cards aimed at disrupting play. Serie A, known for disciplined defensive setups, records around 16 fouls per game but interestingly a higher proportion of red cards due to professional fouls in critical game moments.
This disciplinary contrast impacts player and team behavior. Teams like Arsenal and Newcastle in the Premier League have players climbing the cards leaderboard due to aggressive pressing systems, as discussed in recent match reports for Arsenal’s late winner against Newcastle. Meanwhile, Spanish giants Barcelona often avoid frequent bookings but face occasional disciplinary spikes in high-pressure encounters, such as the recent 4-1 loss to Sevilla witnessed in Sevilla routs Barcelona 4-1.
- Reviewing fouls and cards by league context identifies patterns for scouting and strategy.
- Consider how referee interpretation styles influence card distribution and player behavior.
- Using platforms like Football Manager’s data simulators enriches understanding of discipline management.
- Leverage InStat and Hudl for live match discipline assessment tailored to league trends.
| League | Average Fouls per 90 | Yellow Cards per Match | Red Cards per Match | Primary Discipline Style |
|---|---|---|---|---|
| Premier League | 21.3 | 3.9 | 0.2 | Physical and Fast-Paced |
| LaLiga | 18.4 | 2.8 | 0.1 | Tactical and Technical |
| Serie A | 16.2 | 3.2 | 0.25 | Disciplined and Strategic |
Leveraging Live Data Platforms for Real-Time Discipline Analysis
The football data revolution accelerates the availability and depth of discipline-related insights during live games. Platforms such as SofaScore, WhoScored, and Hudl offer fans and analysts instantaneous updates on fouls, cards, and player positioning. This fosters a deeper engagement and tactical awareness, often influencing viewer understanding and even managerial decisions moment-to-moment.
Through these platforms, the in-match tracking of players nearing card accumulation thresholds becomes a strategic element. Managers might substitute card-prone players to avoid forced absences in subsequent matches. Analysts and coaches cross-reference live data with historical tendencies sourced from Opta and StatsBomb to predict disciplinary hotspots emerging during games.
Games scheduled this weekend benefit enormously from this enhanced data environment. Matches like Juventus versus Inter in Serie A or the crucial Premier League clashes integrate real-time foul tracking with video analysis, making the experience immersive for both supporters and coaching staff. Further, Hudl’s InstatScout delivers detailed post-match discipline reports, allowing teams to fine-tune training and avoid recurring mistakes.
- Utilize live discipline data to optimize in-game player management.
- Identify potentially dangerous players or zones during the match.
- Incorporate video analyses from Hudl and StatZone to review fouls and cards.
- Monitor disciplinary trends to inform post-match training and strategy.
| Platform | Primary Discipline Data | Use Case | Unique Feature |
|---|---|---|---|
| SofaScore | Live cards and fouls analytics | Fan engagement and real-time awareness | Intuitive visual dashboards |
| WhoScored | Player disciplinary ratings | Detailed historical and live performance metrics | Minute-by-minute updates on cards |
| Hudl | Video analysis of disciplinary incidents | Coaching and player development | Integrated InstatScout reports |
| StatsBomb | Advanced foul zoning analysis | Strategic coaching insights | Spatial heatmaps of fouls |
How Discipline Affects Team Strategy and Season Outcomes
Disciplinary issues on the pitch ripple through wider team strategy and ultimately influence season outcomes. Suspensions from accumulated yellow or red cards can disrupt squad line-ups, forcing tactical adjustments. Coaches must balance player aggression with risk management to maintain competitive integrity.
Football Manager, widely respected for its intricate simulation of player behavior, now includes refined modules to project disciplinary consequences based on real-world data. This interplay influences transfer decisions, youth development, and match tactics. Clubs tracking such metrics from platforms like InStat and StatZone incorporate discipline dashboards into their season planning to minimize risks.
There is also a psychological dimension: teams known for controlled discipline may enjoy greater composure in crucial moments, while those prone to fouls may face pressure from referees eager to clamp down on rough play. Analyzing recent European matchups reveals how teams like Arsenal and Manchester City manage disciplinary issues amidst title challenges, carefully navigating the balance as seen in reports like the Premier League 2025 challengers analysis.
- Players with poor discipline can be tactical liabilities, forcing lineup changes.
- Maintaining team discipline supports sustained success across long seasons.
- Disciplinary data informs management on training emphasis and player selection.
- Strategic fouling, if uncontrolled, can derail season ambitions.
- Real-time data assists in minimizing unexpected match interruptions.
| Team | Season Cards | Suspensions | Impact on Matches | Discipline Strategy |
|---|---|---|---|---|
| Arsenal | 54 Yellow / 5 Red | 6 | Multiple key players rested | Focused on controlled aggression |
| Manchester City | 47 Yellow / 3 Red | 4 | Few matches with undermanned squad | Balanced discipline and pressing |
| Barcelona | 45 Yellow / 6 Red | 7 | Disrupted rhythm in crucial games | Emphasis on tactical fouling control |
| Juventus | 49 Yellow / 4 Red | 5 | High tolerance for aggressive tactics | Strict post-match reviews |


